Data Collection
Video is recorded from a public Caltrans traffic live-stream in Orange County, from November 3 at 5:43 PM to Thursday, November 6 at 8:37 PM. The stream is recorded as 15-minute video segments that are uploaded to Azure Blob Storage, with metadata stored in MongoDB.
An Azure-hosted server processes each video using a pretrained YOLO object detection model. The model analyzes every frame, and for each vehicles, captures its coordinates per frame. This raw data can be explored using a reverse-proxy API on this website available at by adding this path to the above url '/api/utc_date/?utc_date_text'. This can be done by subsituting utc_date_text with specific dates at the bottom of this web page (for example, https://ethans-apps.com/api/utc_date/?utc_date_text=2025-11-05T12:43:21.044+00:00).
The raw detections are then aggregated into minute-level directional counts (e.g., during minute i, n northbound vehicles and m southbound vehicles). Users can query these aggregated results using the interactive time slider below. The backend API dynamically aggregates the data based on the selected time range, providing one-minute resolution for shorter intervals and progressively larger aggregation windows (up to six-hour intervals) for multi-day queries.
Car Timeline
Results
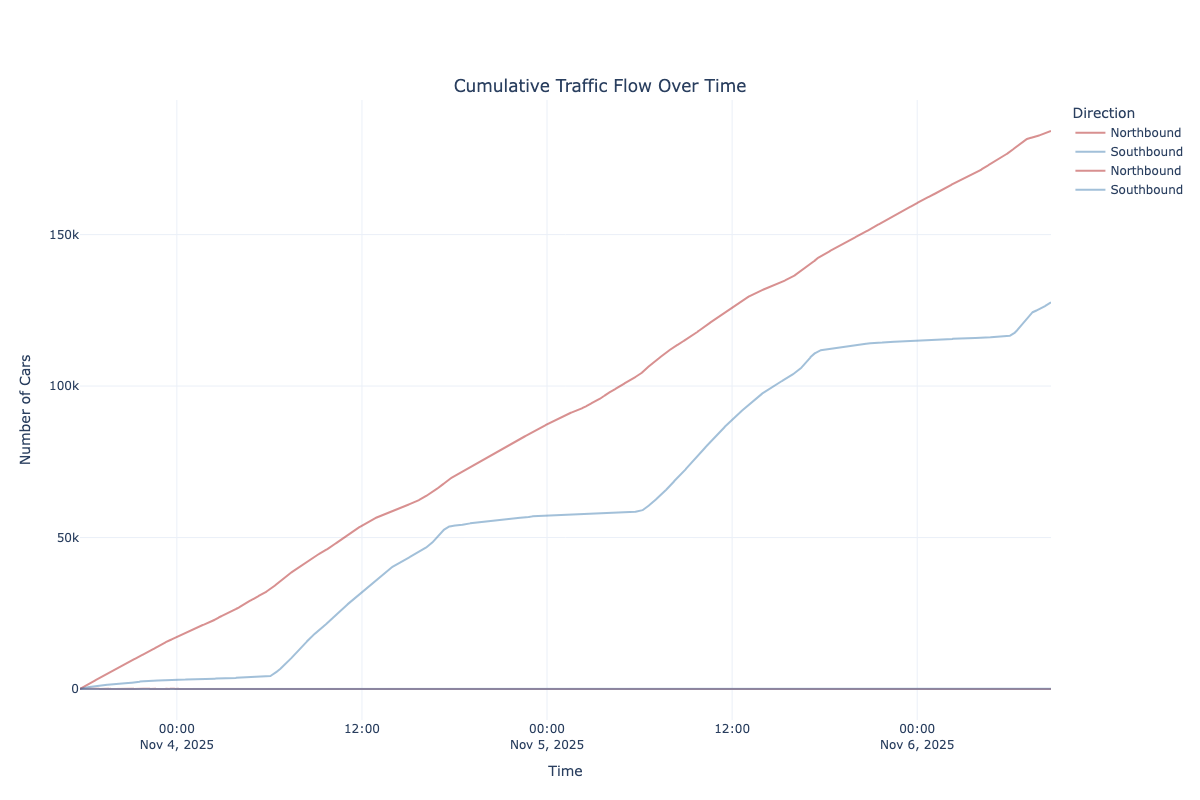
Between Monday, November 3 at 5:43 PM and Thursday, November 6 at 8:37 PM, the pretrained YOLO model detected 184,130 northbound vehicles and 127,663 southbound vehicles. Based on these observations, northbound traffic was substantially higher during the study period. The results are visualized below.
Limitations
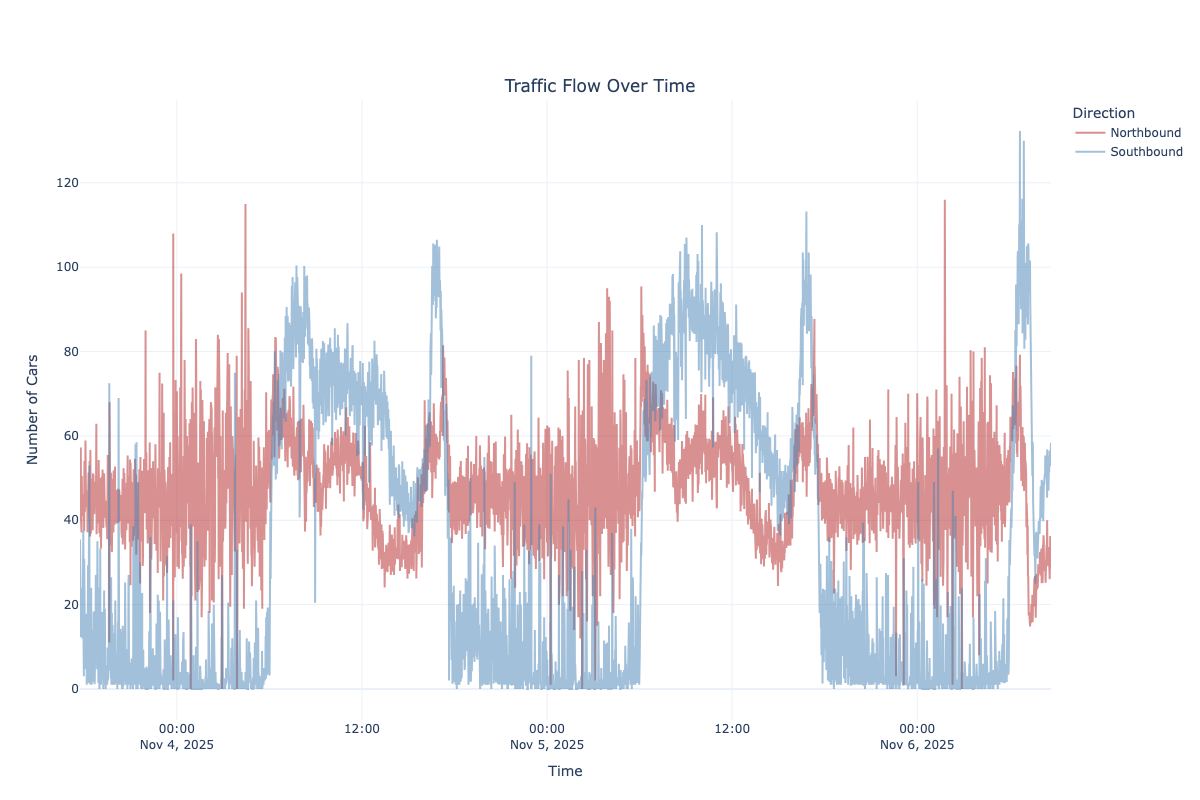
One important limitation emerged during the analysis. Southbound traffic appears to be undercounted during nighttime hours. In the visualization below, the southbound counts decline sharply during periods of low light, particularly around sunrise (approximately 6:00 AM) and sunset (approximately 5:30 PM).
A likely explanation is the camera's placement. Because it is positioned on the northbound side of the freeway, the model views northbound vehicles head-on, making headlights highly visible. Southbound vehicles, by contrast, are farther from the camera and primarily show taillights, resulting in lower visibility and reduced detection accuracy under low-light conditions.
This conclusion is also supported by external traffic estimates. According to the 2024 Caltrans Traffic Census, this freeway segment carries approximately 140,000–150,000 vehicles per day. Over the three-day study period, the model detected 311,793 vehicles in total—approximately 74% of the lower end of the expected traffic volume—suggesting that a meaningful portion of vehicles were not detected.
The next phase of this project will focus on validating this hypothesis and improving detection accuracy by refining or retraining the object detection model for this specific camera angle and lighting conditions.